

Truckstop’s Spot Market Insights: Maximize Profits & Minimize Risk
Gain a deeper
Understanding of the spot market.
Price every load right and make more money. Truckstop’s Spot Market Insights is a must-have resource.
Contributed by: Noel Perry, Truckstop Transportation Economist.
It’s easy to track American rail activity. The Federal Railroad Association requires the big guys, who account for most traffic, to submit estimates of their weekly carloadings. Ask any security analyst who follows those companies for the data. They will put you on a mailing list that summarizes the data weekly. Great! Trucking, in contrast, is the sum of the activity of over 400,000 carriers serving a bewildering collection of lanes under a wide range of circumstances. Making sense of that market is hard!
Until roughly fifteen years ago, we guessed at it. Our data was limited to the American Trucking Association’s (ATA) survey of a small collection of carriers and several other sketchy sources. Moreover, the ATA’s survey came out late the following month from the survey in question. Trying to understand what happened last week? You can only guess what happened using data that is already four to eight weeks old.
However, Truckstop releases a weekly summary of load board activity every Monday, featuring over a million data points from thousands of carriers, far surpassing ATA’s modest carrier count aggregation. My stat professors would call that a ‘significantly significant sample’ given that such a big data set must give an accurate, usable market picture.

With this data, a graph of loads available confidently demonstrates that the current market is average, much smaller than the markets of 2021 and 2022. In addition, the combination of the 2023 and 2024 data tells us that this market is stable, no longer shrinking as it did in 2022, nor expanding as so many market commentators are (hopefully) predicting. When I say “current,” I mean information that is up to date as of a week ago, not from a month or a quarter ago. I have spent almost 50 years guessing at truck market conditions. No more!
What’s the Catch?
This is just spot market data, representing less than 25% of the market. We still must guess about 75% of the market that manages its transactions with contracts. Thankfully, the spot market serves as an excellent leading indicator for the entire market. It addresses the most challenging loads and plays a crucial role as a capacity buffer for the contract sector.
In the past, contracts typically managed the overflow volume. However, this is no longer the case. Now, when a contract carrier needs more capacity, they forward a request to either an in-house brokerage or to an independent broker they trust. Shippers use brokers for the same purpose.
Significance of Spot Market Data
This market segmentation depends on which industry actors need immediate information regarding their next load. In the contract market, most loads move in the same lanes as in previous years in relatively high volume. Negotiations tend to focus on a flat increase percent on last year’s price. The large number of moves (>800,000,000) makes it a difficult data manipulation problem, but the economics are relatively simple, usually managed by an intuitive internal process. Additionally, most contract negotiators consider their data confidential.
The ATA has to work wonders to get their collection of fleets submitting data. As a result, there is little market research to help understand contract truckload markets. When I worked at Schneider National, I was the only market researcher in the truckload market space. In contrast, spot-move economics change daily, depending on many factors, and the decision-makers need lots of market information and need it NOW!
Scott Moscrip, the entrepreneur who founded Truckstop, understood that and created an internet load board that collected such information. The platform gathers data voluntarily submitted by those thousands of negotiators. The negotiators trade their information for information from the other side—making the Truckstop load board a notable example of a crowd-sourced data set.
How to Use Truckstop’s Spot Market Insights Data
You have to distinguish between the desire to research a single load or the broader market. Truckstop’s load board is geared to understanding that single load.
Here’s how it works.
Put in the origin, destination, and truck type in the Truckstop Load Board.
It then calculates the latest summary of loads and pricing for that specific lane, customized to your preferences.
Spot Market Insights is a convenient summary of the entire market with no geographic specificity. The pricing data, in particular, is an average of many moves. Anyone familiar with truckload pricing understands that the price for an individual load varies by lane, headhaul/backhaul, loading/unloading conditions, day of the week, the regularity of the volume, and length of haul.

That means the prices that Spot Market Insights presents, or those that ATA presents, or any summary prices, have little value as absolute price estimates. The specific price for a load could be half the quoted price or as much as double.
The value of the estimates is rather to establish what the overall market is doing.
Is the market above or below normal?
Is it strengthening or weakening?
It follows that the overall condition should apply to individual moves, too. Suppose Truckstop’s millions of data points tell us the market is flat. In that case, those conditions should generally apply to the individual loads a broker or owner-operator is concerned about: volumes should be the same as last month, same for the pricing. Sure, there are exceptions. But, not all transactions are exceptions. The Spot Market Insights data should guide decision-making but allow for differences if the specific conditions of a load dictate it.
Predicting Seasonality
You can suspect seasonality in the accompanying graph of reefer spot rates over the last 60 weeks. There were two peaks in pricing, both right around the new year. That makes sense, – as people do a bunch of entertaining and eating out over the holidays. Sure enough, look to the left at the historical Spot Market Insights reefer data, expressed as the average deviation from the trend for each week of the year. Weeks above 1 are the strong weeks, and vice versa. The data shows a distinct seasonal peak around the holidays. There are also upticks around Memorial Day, July Fourth, Labor Day, and Thanksgiving—lending the ability to predict future changes around key dates.

Apply Data Cautiously
People love to look at Spot Market Insights each Monday to see if the market has changed. They should do this very carefully – for two reasons. First is the matter of seasonality. Someone asked me recently, “What is going on in the reefer market? It’s up sharply.” My questioner was wondering if the reefer market was entering a period of growth, soon to be repeated in the other truck types.
Since the question came during the first week in January, I sent my friend the reefer seasonality chart above. He quickly realized that the movement he saw was the normal year-end spike in reefer prices. The stores want extra food at a time when many truckers are taking some much-needed time with their families: demand is up, supply down, and prices spike. My friend now expects quite confidently that reefer rates are about to fall as demand softens and supply recovers. When you look at Spot Market Insights data, think hard about seasonality when interpreting the numbers.
Account for the Unknown
If you want to sweat weekly changes in market conditions, you must understand that week-to-week changes are subject to significant random variation. Maybe there were weather problems, a change in posting habits, or a temporary surge in volume. Whatever the reason, a blip in volumes for one week does not a trend make.
In 2022, spot loads fell consistently for 30 weeks, a true trend. At a minimum, use the Perry Rule. A statistical change must last for three consecutive reporting intervals (weeks in Spot Market Insights) before you can even consider it a trend.

Telling the Story Through Data
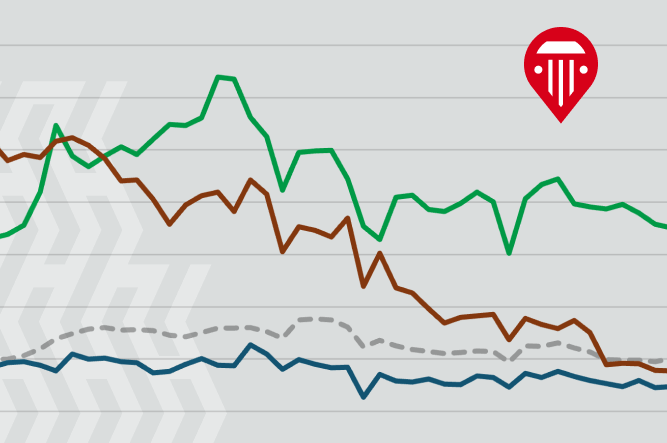
To fully understand market trends, you must account for all the data points and interpret their greater meaning. First, compare the red line to the grey dotted line, which is the average load level since 2008. Since most of the entries for the last 60 weeks (red line) are below the grey line, you can conclude that reefer volumes are less than normal (average). This is a moderately weak market.
Now, compare the red line to the dark vertical bars, the actual data without seasonal correction. This shows that most recently the red line was below the bar, indicating that the underlying market was not as strong as the reported data suggests because of normal seasonality. Next, squint at the chart’s red line and figure the 60-week trend in the data, ignoring its variations.
You should see a modest decline in the data (red dotted line). It was equal to the grey line a year ago, but is below it now. We conclude that the spot reefer market is slowly weakening.
You should also see how squiggly the data is, both the red line and the bars. That is the variation mentioned previously. Using the Perry Rule of Three, you can dismiss much of the variation and concentrate on the periods when the market moved in the same direction for more than three weeks, as between weeks 5 and 15. Those movements were worth reacting to, the rest were not.
Finally, according to the bars, we are in the midst of an upward move. That movement is worth watching, but with this qualification. You can see that the seasonalized data dampens the increase, as it should. The seasonal patterns in reefer are notoriously inconsistent. Recently, they have been pronounced during the holidays, much more than historically normal.
So, should I update my seasonals to reflect this new ‘reality’, or will the market return to its normal patterns next Christmas? We won’t know for sure, so I am staying with these seasonals and watching carefully over the next few weeks to see how the numbers turn out.
A Delicate Balance
Any attempt to measure a system as complex as the U.S. spot truckload space will be plagued with uncertainty. A good artist then does two things. First, they isolate the things about which we can be certain. In this case, we know for sure that the reefer market is much lower than it was two years ago and is now ‘slightly’ below normal. It’s a disappointing market, for sure. But not a recessionary market. That would be much lower on these metrics.
Second, the artist handles the immediate data, the week-to-week comparisons, with great delicacy. Unless the data moves consistently one way or the other, the artist uses it more as an indicator of what to look for than proof of a trend. Is the reefer market now headed above average? Maybe. Still, it could just be a seasonal effect that should be monitored closely. Like any good businessperson, a good economist knows what is for certain and what is not, and acts accordingly.

Noël Perry is an industrial economist best known for his work in transportation and machinery markets. Entering the professional world in 1976 Noël has built and managed forecasting processes in three major companies Cummins Engine, CSX and Schneider National. He has been in private practice since 2008, working with clients in four modes, investment analysis and the shipper community. Frequently quoted in the national logistics media and heard widely on the speaking circuit, he also serves as economist to Truckstop.com. Mr. Perry’s forecasting practice includes groundbreaking work in volume, pricing, and capacity with a particular emphasis on risk analysis. In addition to his national and industry analysis Noël has extensive experience in pricing transaction support.
Noël holds degrees from the University Of Pennsylvania and Harvard University (Honors) and navigated USAF KC-135 air refueling aircraft during the Viet Nam war. He and his wife Ginny live in the historic iron mining village of Cornwall, PA. In his spare time, Noël is a gardener, singer, golfer, WWII historian and is a member of the Society for American Baseball Research.


Get helpful content delivered to your inbox.
Sign up today.
Find high-quality loads fast, get higher rates on every haul, and access tools that make your job easier at every turn.
