

Truckstop.com's Market Demand Index
Listen up!
Check out our podcast, Behind the Freight, where industry experts talk all things trucking.
What It Is
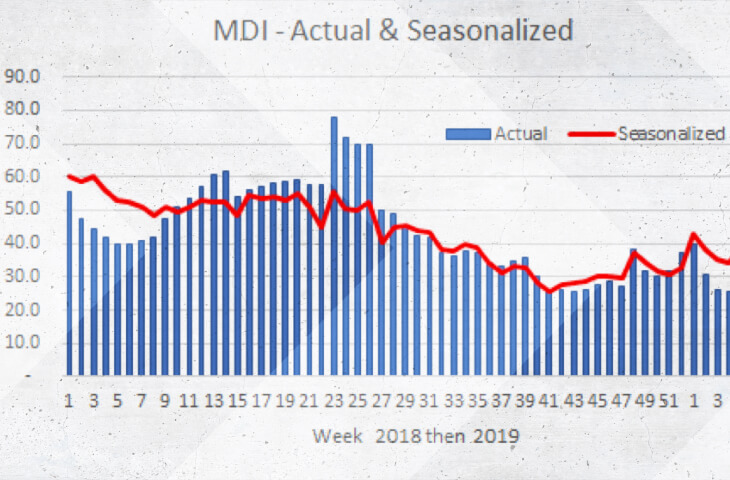
This graph shows the ratio of loads posted to trucks posted by equipment type.
Why It’s Useful
- This chart shows that while the actual MDI (blue bars) has increased over the past two weeks, the seasonal MDI (red line) has remained flat.
- This tells us that the MDI increases were expected and align with typical seasonal patterns that we see at this time of year.
What It Means for Carriers
- Capacity is tightening as produce and other seasonal freight picks up, but the market demand isn’t fluctuating outside of “normal” range.
- Spot rates are below the levels that we saw at this time of year in 2018, but they’re still above years 2016 and 2017.
- Ensure you’re watching the rates on excess tenders or spot freight – especially in early-season produce areas like South Florida, Texas, and California.
What It Means for Brokers
- Capacity is tightening as produce and other seasonal freight picks up, but the market isn’t fluctuating outside of “normal” range.
- Spot rates are below the levels that we saw at this time of year in 2018, but they’re still above 2016 and 2017.
- Follow normal seasonal rate expectations, but watch out for additional tenders or increased tender lead time – especially for refrigerated freight in early-season produce areas like South Florida, Texas, and California.


Get helpful content delivered to your inbox.
Sign up today.
Find high-quality loads fast, get higher rates on every haul, and access tools that make your job easier at every turn.
