

Spot Market Quarterly Review – Q1 2024

Gain a deeper
Understanding of the spot market.
Price every load right and make more money. Truckstop’s Spot Market Insights is a must-have resource.
The spot market rates have long been a leading indicator of the health of the market. They provide valuable insight to allow brokers and carriers to plan for the months ahead.
As we reflect on Q1 2024, we saw muted activity with volumes in a normal range but prices lagging behind inflation. This created a situation some refer to as a “pricing recession.” The forecast predicts a slow climb in prices throughout the year, unlikely to fully recover from the current slump.
Learn what the data tells us about the coming months in the spot market and how it impacts the transportation market.
Key takeaways
- Level Setting: Volumes are in the normal range, not at recessionary levels. However, when prices are corrected for inflation, they are well below trend in the spot market, The spot market is in a ‘pricing recession.’
- The outlook is for more of the same in the absence of some major unexpected development. Prices will increase some, but not nearly enough. The pricing issue is excess supply that is only slowly falling.
- There are modest upside risks in pricing and a more significant 2025 risk on the downside.
- The closing commentary explains why the upward market inflection that everybody wants is unlikely.
PART ONE: LEVEL SETTING:
What happened in the macro economy in 2024 Q1?
If you open the BEA quarterly release [1] and select the table option, then tab two, you will see a calculation of the contributions to GDP by the major segments of the economy. The total for last quarter was 1.6% in annualized [2] growth. That figure is well below expectations that were based on stronger results in 2023.4.
However, those expectations were based on hope rather than good analysis because 2024.1 was well within the recent range of results. Since the beginning of 2023, growth has averaged 1.6%, right where Q1 came in. This data tells us in no uncertain terms that the economy is growing slowly and relatively steadily. It is no boom, nor is it a recession.
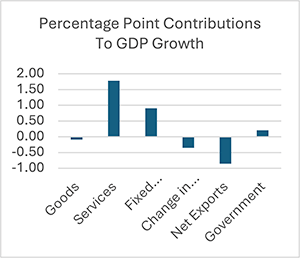
Services dominated the most recent quarter.
The chart above shows the percentage point contributions of the six big economic segments. Services contributed 1.78 points to the total of 1.6 points. The means the other segments total to a negative. For the Dallas Cowboys fans among you that is 1.6- 1.78 = -.12, a negative. Unfortunately, those other segments are the intense trucking segments. We have, then, a negative mix issue in trucking macroeconomics.
What is happening in trucking – volumes.
Our industry grew at only .8% annualized in Q1, while the spot segment grew at -.34%. Is this a ‘trucking recession’? Not yet; read the commentary section of the outlook for more on that. That discussion will show that spot freight is still slightly above the long-run trend, even if it has suffered reverses over the last two years. Remember, in a recession, volumes are below trend.
There is a truckload PRICING recession!
Overall before-fuel truckload prices, in contrast, were up by 1.9% annualized. That’s certainly to the good. However, spot prices are well below the trend, especially when factoring in inflation. The discussion in Part Four will show that average spot prices are more than $.70 per mile below the trend when accounting for inflation. THAT puts spot market truckers in a recession.
PART TWO: THE BASE CASE FORECAST:
The remainder of the year will bring more of the same in freight volumes.
As I have pointed out elsewhere, market conditions, when measured on a quarter-over-quarter (QOQ) basis, change little, staying stable enough for operators to continue what they were doing in the quarter before the forecast. This is certainly the case in today’s market.
Truckload volume growth[3] has averaged .6% per quarter over the last year, quite close to the .2% growth in the forecast over the next four quarters. Any competent operator can adjust output down by .4% per quarter. Of course, individual quarters will vary from that number. However, even in the volatile spot market, they do not vary by more than 2%.
Note that, importantly, the economy is in its normal slow-to-medium pattern between booms and recessions. It takes some significant event to jar the market from that pattern. No such event is present. As the commentary in Part Four discusses in detail, people are hoping for an upward inflection from this slow-growth pattern, but with little data to back those hopes. The market is not in recession, nor is it ready to boom. As Yogi Berra would say, “It is what it is.”
Pricing should move slowly upwards from ‘very bad’, but not enough to give many carriers relief.
Prices are stuck in a rut caused by the imbalance between slowly growing demand and the slow shrinkage from a record burst of capacity. When truckload prices surged almost 50% in 2021, new entrants increased capacity by almost 20%, despite a volume increase of only 5%.
Since then, the return to normalcy has fortunately put the market back on its normal annual volume increase of about 1% yearly, creating a total 6% increase in demand since the end of 2019. Again, there is no trucking volume recession here. Unfortunately, capacity, although falling, remains at 16% above the 2019 number.
Those economics are the cause of the current truckload pricing recession. It will not end until supply and demand come back into equilibrium, an event likely beyond the end of next year. Although prices will increase slowly, it is likely they will remain below equilibrium in real terms (inflation corrected) until the next trucking boom, whenever that is.
Truckload pricing generally lags below its long-run trends, except during boom periods when the industry finally catches up – until, sadly, the next softening of conditions puts them below trend again. I expect quarterly spot prices to increase by 3.1% per quarter through the end of 2025. However, that encouraging number includes both fuel and inflation. Without those two factors, the average QOQ increase would be 2%. Such increases will still leave carriers $.50 per mile below trend at the end of 2025.
PART THREE: RISK TO THE FORECAST:
The one certainty in this forecast is that the base case forecast WILL be wrong.
Although it will probably be in error by a small amount, understanding the possibility and effect of larger errors is of prime importance. For instance, in late 2021, it was very likely that pricing would fall in 2022. Would the fall be modest, as most people believed? Or would it be substantial, as it was in 2018 after the ELD changes? Answering that forecasting question was very important.
Most people took the optimistic, modest choice and soon very disappointed – and unprepared. Fortunately, in 2024, such major changes are unlikely to occur in either direction. However, many economists are concerned about significant downside exposures in 2025, given mounting debts and major political uncertainties. Accordingly, it is useful to consider the magnitude and likelihood of such changes.
The upside is limited: In this forecast, the upside risks are relatively small because of the small chance of a major market boom. Upside adjustments will likely be limited to 2% per QOQ volume growth with a 20% probability. That puts the expected value of any volume effects at .4%, which is not worth spending much time worrying about.
Upside pricing growth is worth more thought due to inflation and fuel price risks, plus the possibility of accelerating capacity departure. I put the effect of those risks at 5% per quarter with a .35% probability. That pushes the expected value of price effects to 1.8%, more than four times as important as the volume risks.
I see very little possibility of a bigger market boom occurring during the next seven quarters. The only easily identifiable such upside risk would be the imposition of a nationwide heavy-truck speed limit that would cause an immediate spike in pricing. For better or worse, that event is unlikely, even if the FMCSA would love to implement it.
Should the FMCSA get its wish, the change would create a boom similar to the 2020 event. Because of strong resistance to the idea, it sits at a very low probability, less than 5%. So, 7% price increase per quarter at 5% yields a .35% expected value, which is not worth analyzing, especially since the market would get plenty of warning.
Warnings matter, as we learned from the difference between the ELD mini-boom and the COVID big-boom. The former was expected. That latter was a surprise.
The downside risks are worrisome.
The downside risks have the opposite shape of the upside risks. The short-run risks are relatively small and unlikely because the market has already adjusted to major downside pressures. I put the 2024 volume risks at 1% with the pricing risks at 2% per quarter with a probability of 10%. That yields an expected value of .2%, half of the short-run upside exposure.
However, as the seven quarters mature, the chance of a full recession builds, leading to substantial downside risks in the -4% on volumes and -6% on pricing ranges. I put that probability at 20%, leading to expected values of -.8% and -1.2%. Those numbers don’t seem like much compared to the upside numbers, except there is excess capacity and depressed pricing already.
Moreover, the downside risks are all the more important because of the chance of a major downturn, one like the 2008-09 event – or worse! Because the chance of such an event is very small in 2024 or 2025, I do not recommend giving them much thought in the summer of 2024.
However, as this decade matures, they grow. Think of it in expected value terms: the volume risk could be as high as -10%. With a short-run probability of less than 5%, the expected value is -.5% or less. With, alternatively, a longer-run probability of 30%, the expected value jumps to -3%, much larger than any of the other risks considered above.
As this decade matures and the probability of this risk rises, planning for it will become very important, perhaps a survival imperative. Sometime over the next year, I will write a commentary on this risk, which I will label ‘The Depression Of The Twenty-First Century’. That piece will be something to file away in the ‘worry about later’ drawer.
However, perhaps it will help you understand why someone like Jamie Dimon, CEO of JP Morgan Chase, is so worried. You should hear my Austrian Economist friends go on about this. But, in 2024, I am more concerned about shooting my age in golf than about going to the bunker to survive a depression. I am sure Mr. Dimon is still planning to travel by corporate jet this year as well.
PART FOUR: MONTHLY COMMENTARY – WHERE’S THAT INFLECTION POINT?
It’s on everybody’s mind.
In Phoenix last month at the TIA convention, everybody wanted to know when the market will arrive at an ‘inflection point’; you know, “when the recovery from the freight recession starts.” According to some, that recession has lasted longer than the preceding COVID boom.

Let’s see if that makes sense.
I’ll start with the two important words in the question: Investopedia says a recession is “a significant, widespread, and prolonged downturn in economic activity.” The Oxford Dictionary says, ‘Inflection’ is “a time of significant change in a situation; a turning point.” So, let’s look at the GDP numbers to see if either of those words applies to macroeconomics in early 2024.
The accompanying chart plots U.S. real [4] GDP since 2020.1 against the trend in real GDP since 2000:1. One would expect that a ‘significant, widespread, and prolonged downturn in economic activity, a ‘recession’, would produce GDP numbers below the trend line, like in 2022:2. We see instead that current GDP numbers are above trend. In fact, they were getting better until the 2024:1 number slowed.
Usually, economists are reluctant to commit to a direct answer, rather responding with a version of the classic ‘it depends’ answer. Not so here. The U.S. is clearly not in recession. Is this because of some inflection in activity? Yes, we had a major inflection in 2020 that expanded the economy dramatically before things inflected back to normal in 2022.
We then had a small inflection in 2023, but not enough to stress the economy. Now, with the trend already favorable, we are unlikely to get the significant upward inflection that so many people want in the near term. Inflections are usually the opposite of what is happening before the inflection. That normal pattern would create a downward inflection under the current conditions.
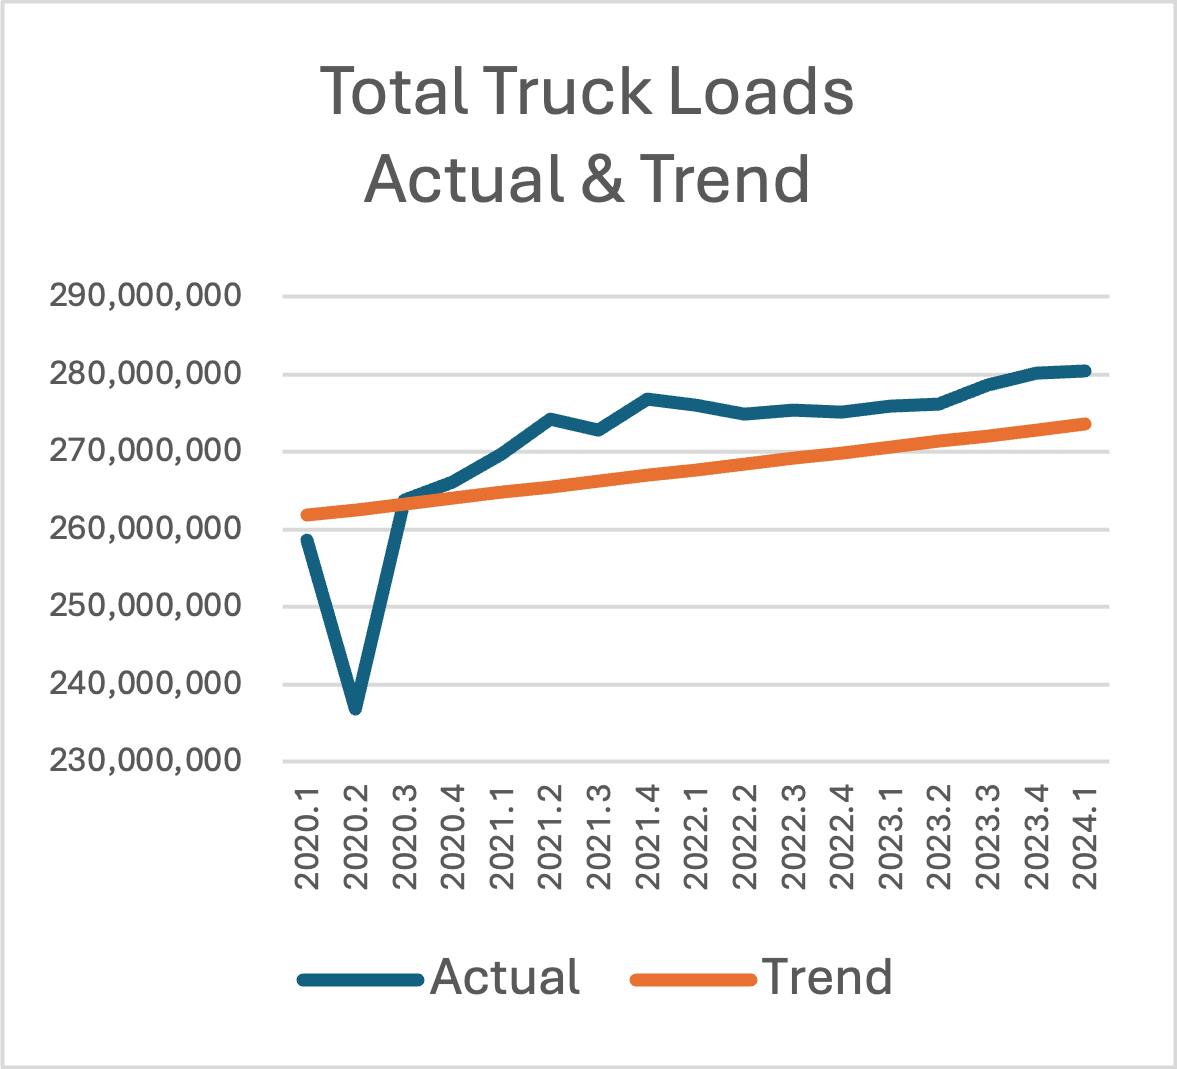
But could this macroeconomic situation be hiding a FREIGHT recession?
Sure, there could be a macroeconomic mix issue that suppresses freight demand despite an otherwise healthy economy. I have been talking about such mix influences for several years. Let’s see what the freight numbers show. They show the same story as the GDP numbers; Good growth in 2020 and 2021, then a little growth in 2023. Again, numbers above trend are not recessionary numbers. Will these numbers inflect upwards soon? Remember the definition of inflection. There is little chance of a significant upward inflection from already positive numbers.
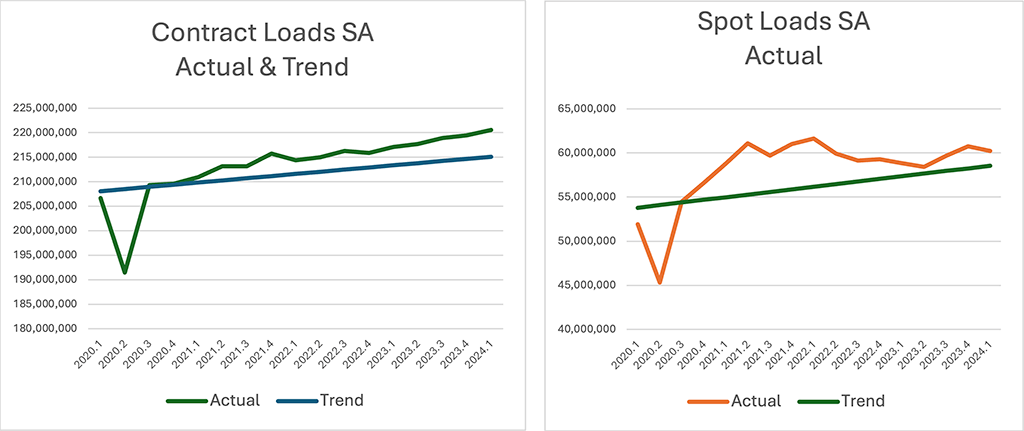
Is there something going on in the freight mix?
There sure is, and it gives us our first clue about this puzzling freight recession talk. Contract freight shows a stronger picture than spot freight because, as the COVID boom slowed, there was the normal shift of formerly distressed freight from spot to contract markets. You can see the falling volumes in the spot picture to the right.
However, note that spot freight remains above trend, out of recessionary territory. We can now understand that the fleets’ talk of a freight recession has to do with their comparison of recent results and the 2021 boom. Sure, spot freight is down from where it was. But here’s something to take seriously. If this were a real economic recession, spot freight would be much, much lower. So would contract freight.
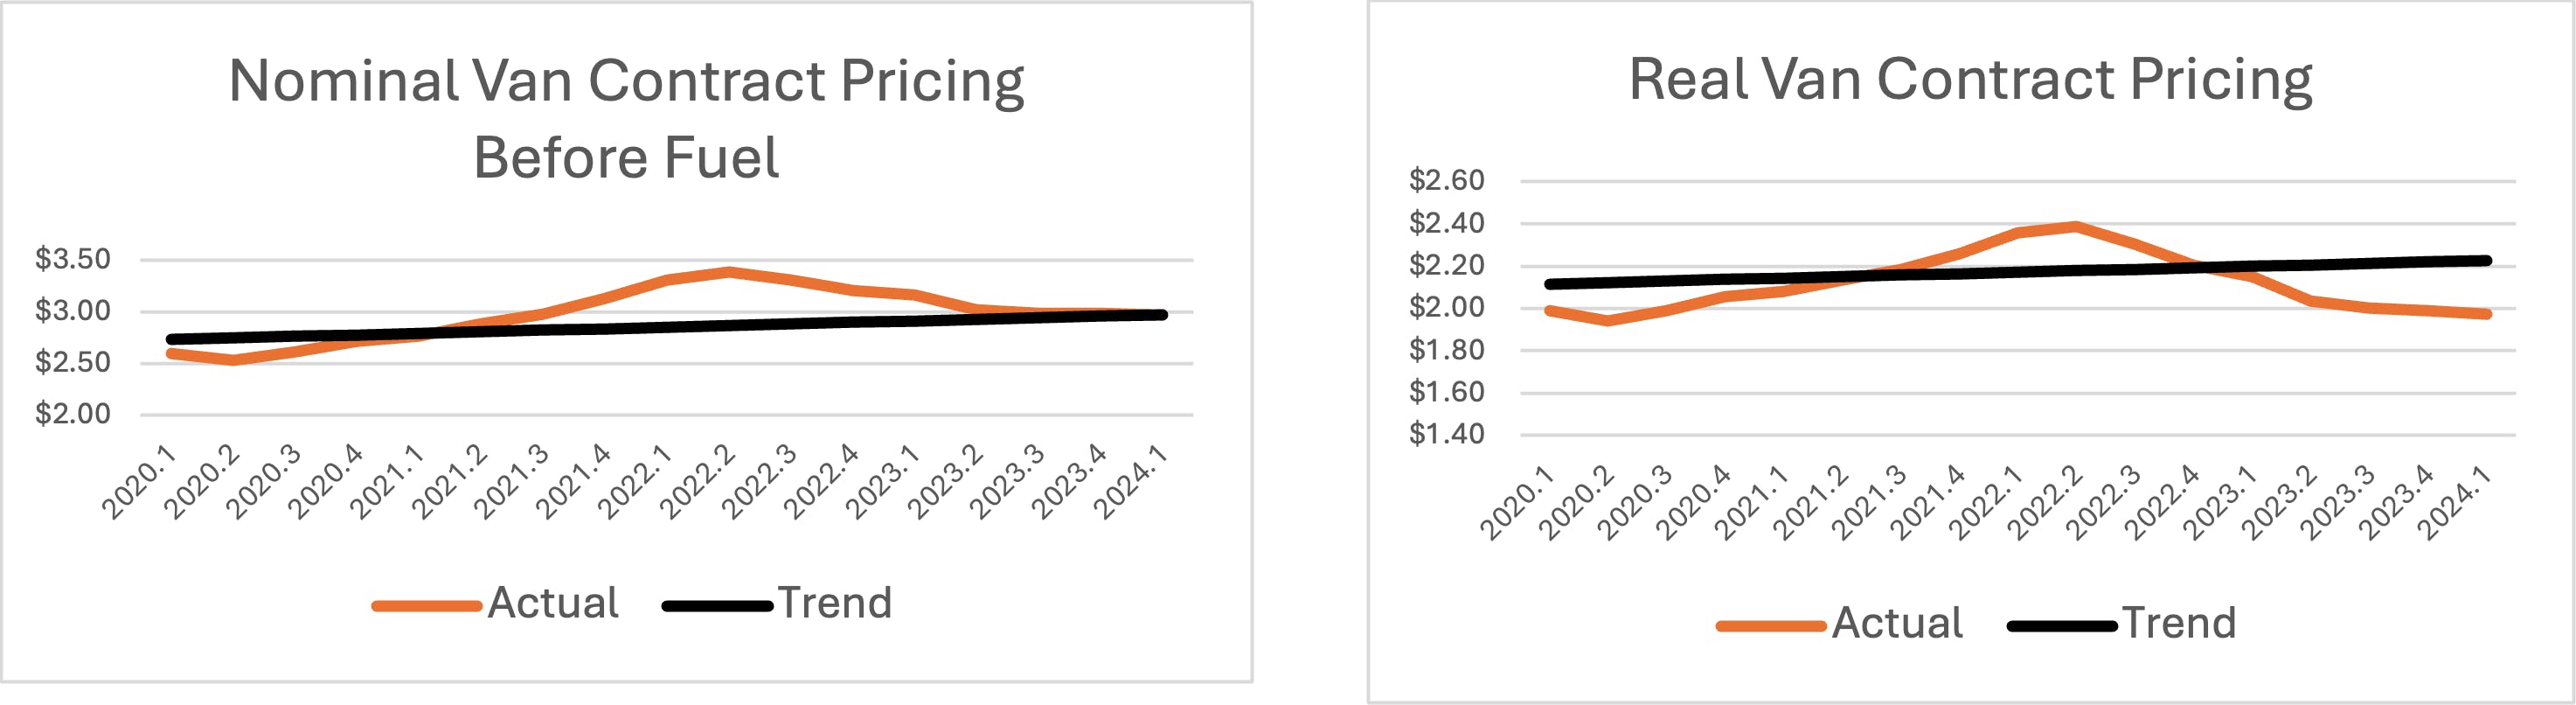
How about rates?
Finally, here’s some data to really chew on. On the contract side, prices peaked, 60 cents a mile above the trend before falling back toward the trend after the boom ended. Contract rates have been basically flat the last year.
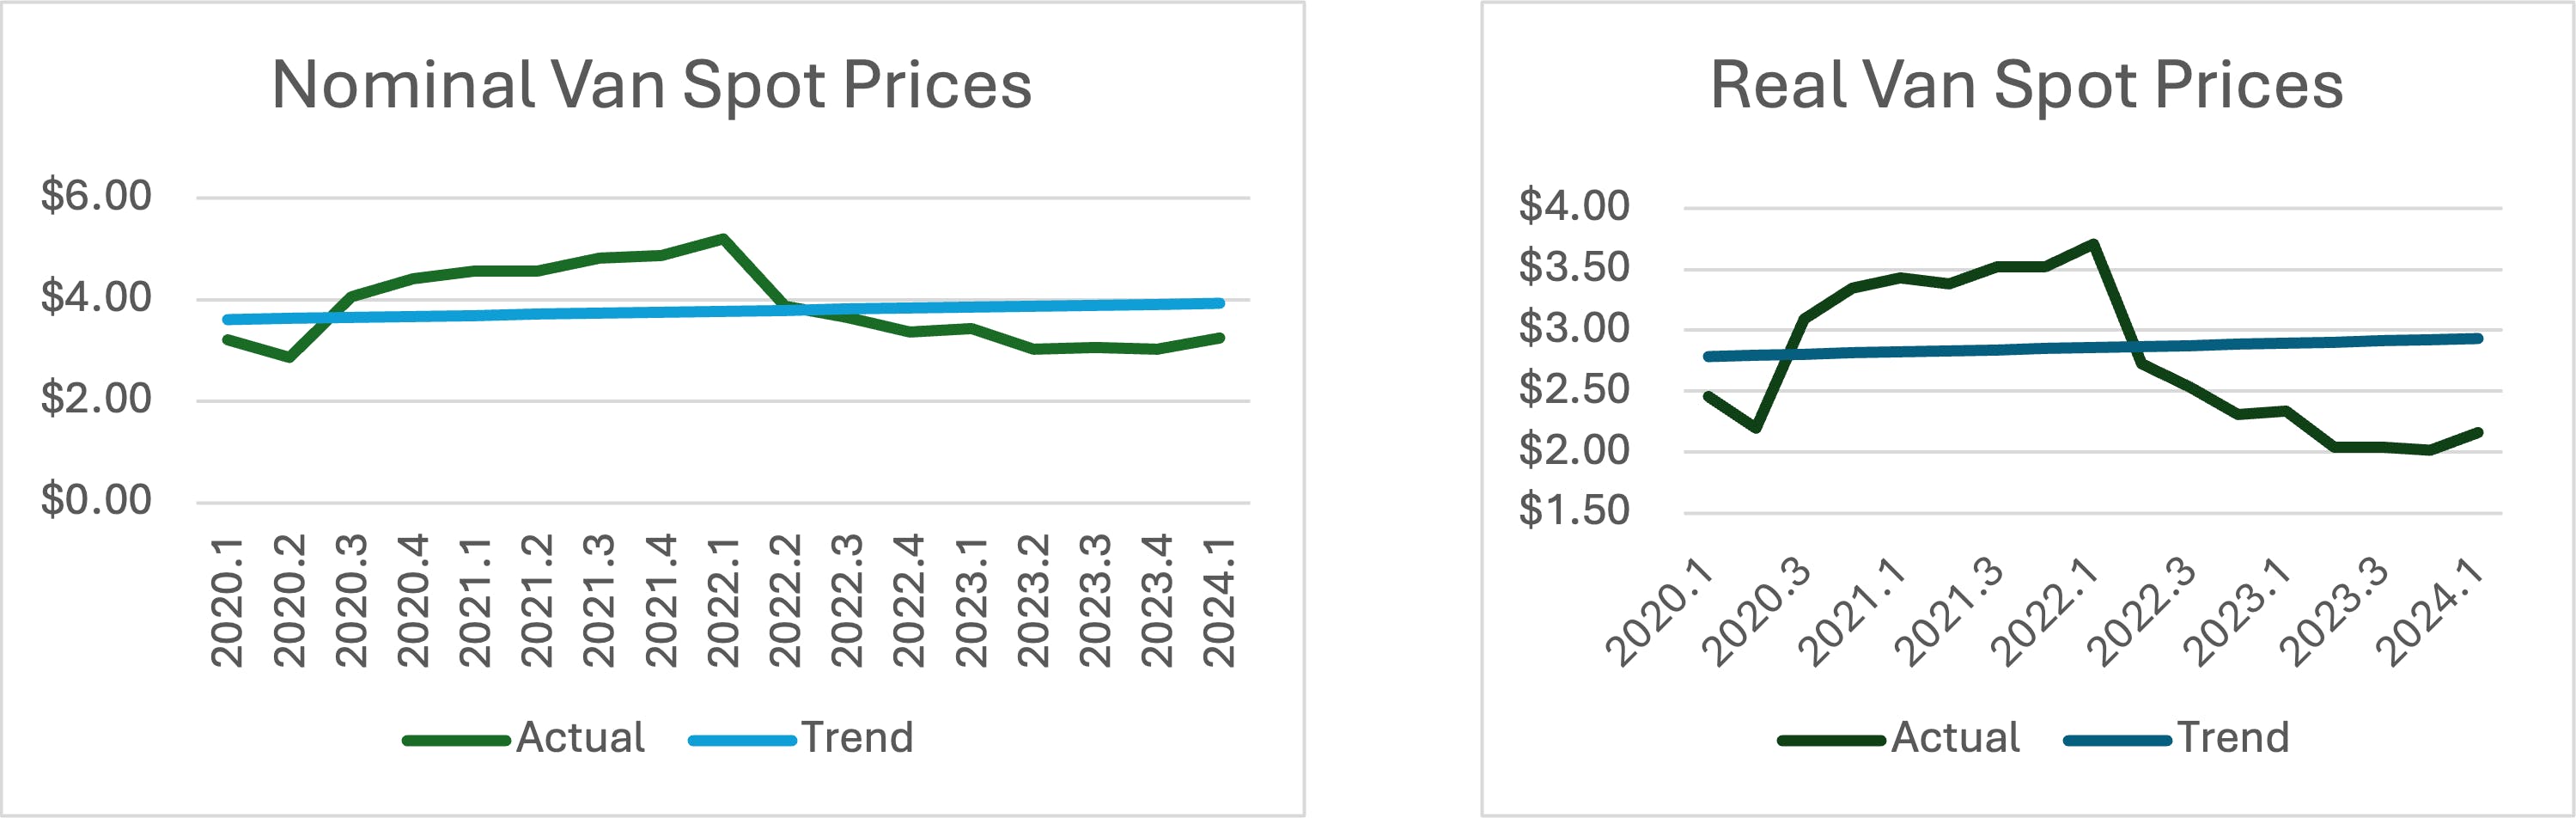
However, that story, as shown in the lefthand graph, is for ‘nominal’ rates, calculations that include the effects of inflation. When we factor out inflationary increases, as shown in the righthand graph, we see that rates are below trend. The fleets have been unable to keep pace with inflation. That has generally been the case in soft markets for many years. Contract markets are in a mild pricing recession. That’s why the big fleets reported disappointing results for the first quarter of this year.
The spot market has a tougher cycle:
Success in this segment requires managing big volume swings and price swings. Sometimes, things look very good, as at the peak of the recent boom, when nominal prices were $1.42 above the trend. Sometimes things look very bad, as in the second half of last year when nominal prices were $.90 below trend. When corrected for inflation, the situation is currently even worse, with prices 30% below trend.
It is true that a carrier can survive for a while well below trend. That has happened multiple times since 2000:1. However, this down cycle is almost twice as severe as previous cycles. One can, therefore, conclude that the Spot Market is at least suffering from an unprecedented ‘pricing recession’.
When will that pricing recession inflect?
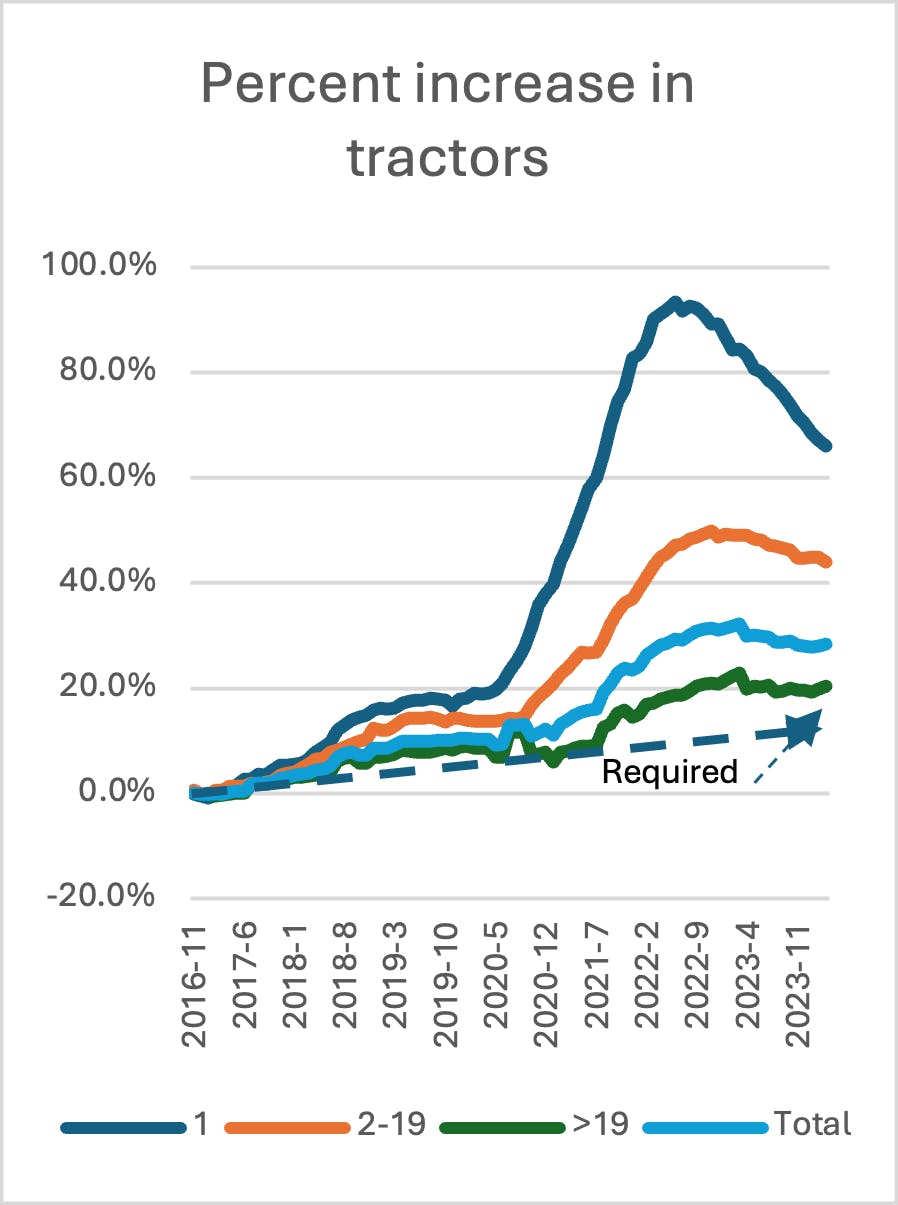
Unfortunately, the discussion above regarding volumes says that a significant increase in demand is unlikely. That means an inflection in pricing must come from a decrease in supply. The data we have from the FMCSA on capacity shows the total market to be about 25% above its 2016 capacity, with only a small reduction occurring over the last year.
This surplus comes at the hands of small fleets and owner-operators who increased capacity by almost 50% and 90% late in the boom. Both are decreasing now, but not nearly as much as is necessary to bring pricing up quickly. What’s worse, the big guys are holding their capacity at 20% above their 2020:2 levels.
You can also see, fortunately, in the chart that the trend increase in demand requires about 9% more trucks than at the start of 2016 when this latest era of surges began. That makes the problem somewhat more solvable but still not easily solvable.
What’s the forecast?
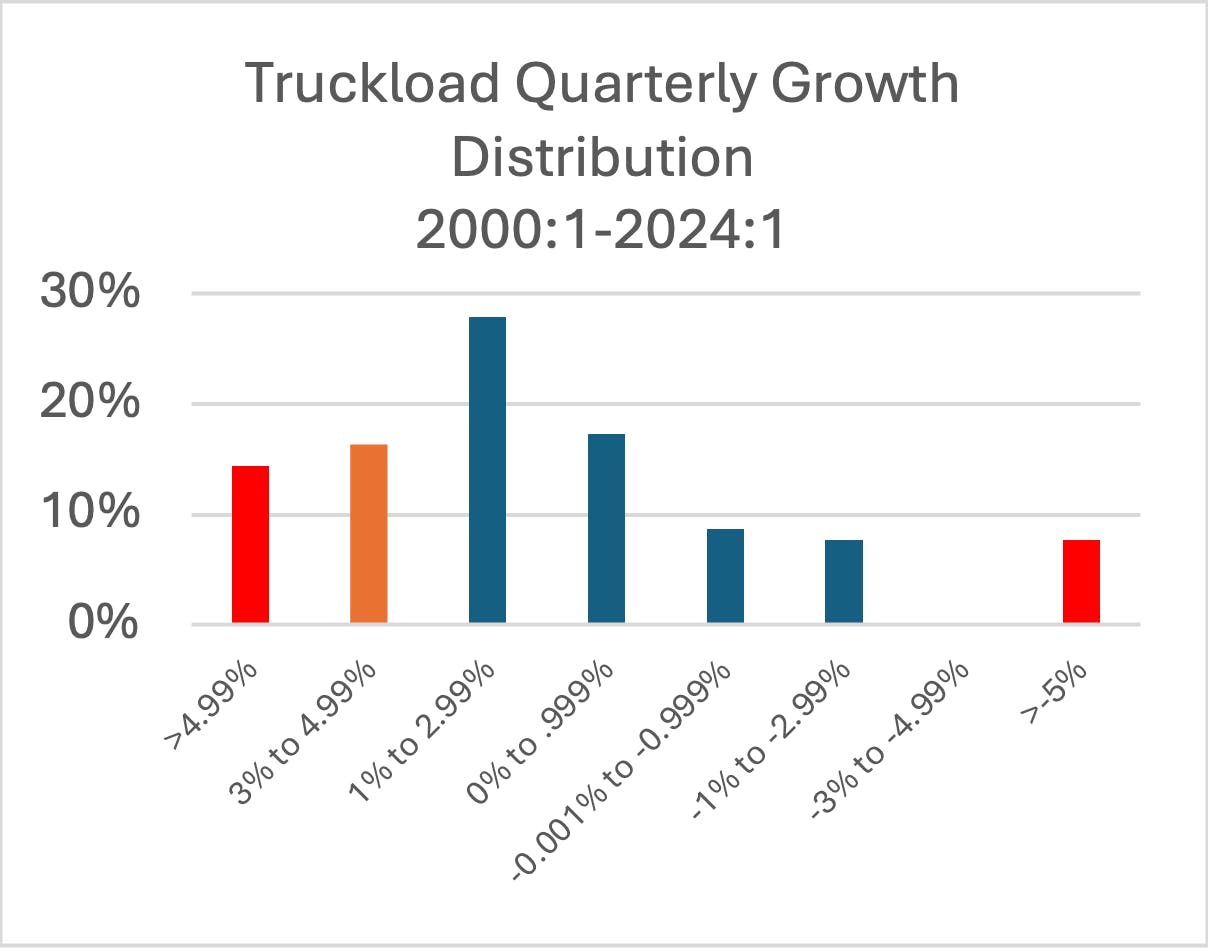
Look carefully at the next chart. It shows the distribution of quarterly growth for the truckload market since 2000:1. Most quarters, 61% (in blue) show little growth or shrinkage. 16% show modest growth, enough to hope for a boom or fear a recession. The remainder, 22%, indicate strong market change, up or down.
This distribution tells us what to look for in a forecast, specifically quarters where the market changes significantly. Most of the time, that doesn’t happen. But when it does, it sure helps to be ready.
In the rest of 2024, then, we are looking for signs that the market will produce two or more of those rare quarters when things change meaningfully for the better. Over 24 years, the odds of that are about 10%. Except that we have had nine consecutive quarters without such growth, a strong indication of a contrary trend.
Put differently, in the truckload market, the strongly growing quarters all contain either an unusual demand issue or an unusual supply issue, often both. For instance, in 2017-2018, we had a combination of strong demand growth and the suppression of supply by the ELD requirement. In 2020-2021, we had REMARKABLE demand growth, and the drug and alcohol database suppressed supply.
In 2024, there are no indications of a demand spike, and the regulatory calendar is quiet. Moreover, the global economic/political environment could easily hurt demand. We see that the realistic test for a recovery forecast is the presence of one of these dramatic influences. Without them, we will get more of the same.
Things will be tough in the spot market:
Sadly, the quiet market data, including 2024:1, says the spot market will not get back to equilibrium for about five years, barring a dramatic increase in the market exit stats. Will that happen? The industry survived five years of pricing below trend from 2012 to 2017, albeit at smaller deficits. Most likely, such extended stress will bring down capacity more rapidly than currently occurring. So far, reductions have only happened slowly because people have been reluctant to acknowledge the seriousness of the surplus.
The issue lies with the small operators, people with less than twenty trucks, including owner-operators:
Importantly, they were the actors who were fired up with entrepreneurial spirit when the market took off. New entrants swelled the carrier count by 81% at the end of 2022. About 20% of those newcomers have left or joined big fleets. That leaves us with many operators, old and new, struggling with their finances. Logic says the decline in carrier count will continue, probably accelerating.
The sketchy data from before 2016 indicates that the recent sudden increase in new fleets is unprecedented, probably an anomaly. I conclude that, even with continued increases in the spot market share of the total truckload market, the sustained carrier count will be 10% to 20% above the 2016 starting point, not the 61% increase currently in place.
Think of this event like a tidal wave. It swells beyond normal comprehension before receding into the history books. We will be talking about the 2020-2022 spot market surge for a long time as the one-off calamaty it certainly was. We will also be talking for a long time about the painful surplus and carrier failures that followed.
The COVID transport crisis was not a new normal.
The surge in volumes has come right back to the old normal. The even more extreme surge in spot pricing has collapsed as such things always did in the past. The only thing left unsettled is the extreme surge in carrier and tractor counts. In the absence of some radical new phenomenon, those counts will eventually return to the old normals.
We are left then with an understanding that dramatic external events, a pandemic, a widely flawed governmental response, are sadly, the real new normal. That new normal is the presence of radical swings in market behavior that temporarily displace the market from its old normal behaviors. Those behaviors remain with us, except when overpowered by these troubling new forces.
In a single sentence, then: The new normal is high volatility, not some change in market behavior that pumps volumes and pricing permanently higher.
It follows that the remainder of 2024 will be much like 2023: normal volumes and problematic pricing. I expect volumes to grow slowly, on trend. Pricing should make some modest gains as the excess capacity bleeds out. Unless, however, that particular form of industry pain gets worse, pricing will remain a critical problem for the rest of the year and much of next year.
As my friend Larry Gross, the distinguished intermodal economist, reminds us, truckload pricing usually waits until the next boom before it recovers fully. I see no boom in the next several years.

Noël Perry is an industrial economist best known for his work in transportation and machinery markets. Entering the professional world in 1976 Noël has built and managed forecasting processes in three major companies Cummins Engine, CSX and Schneider National. He has been in private practice since 2008, working with clients in four modes, investment analysis and the shipper community. Frequently quoted in the national logistics media and heard widely on the speaking circuit, he is also serves as economist to Truckstop.com. Mr. Perry’s forecasting practice includes groundbreaking work in volume, pricing, and capacity with a particular emphasis on risk analysis. In addition to his national and industry analysis Noël has extensive experience in pricing transaction support.
Noël holds degrees from the University Of Pennsylvania and Harvard University (Honors) and navigated USAF KC-135 air refueling aircraft during the Viet Nam war. He and his wife Ginny live in the historic iron mining village of Cornwall, PA. In his spare time, Noël is a gardener, singer, golfer, WWII historian and is a member of the Society for American Baseball Research.
[1] Gross Domestic Product, First Quarter 2024 (Advance Estimate) https://www.bea.gov/news/2024/gross-domestic-product-first-quarter-2024-advance-estimate
[2] ‘Annualized’ growth is the result if the growth for one quarter continues for a full year. It is roughly four times the single quarter growth (plus compounding effects).
[3] As measured by truckloads.
[4] Inflation corrected.
Topics:


Get helpful content delivered to your inbox.
Sign up today.
Find high-quality loads fast, get higher rates on every haul, and access tools that make your job easier at every turn.
